Foundations of Quantitative Political Analysis II
Workshop Link to heading
Data Collecting Link to heading
Data can be collected in different file formats. The major distinction is between tabular data formats and non-tabular data file formats.
Tabular data formats Link to heading
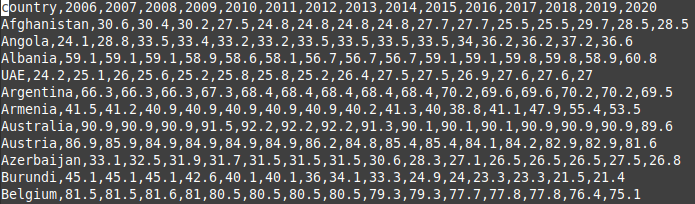
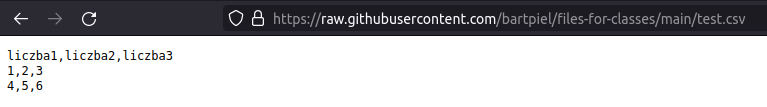
Tabular data file formats are formats which allow to save data in forms of raws and columns. The most basic tabular data format is a comma-separated values (.csv) file. This is a text file that use commas to separate cells from each other. Because CSV-formatted files are text files, they can be open by a text editor:
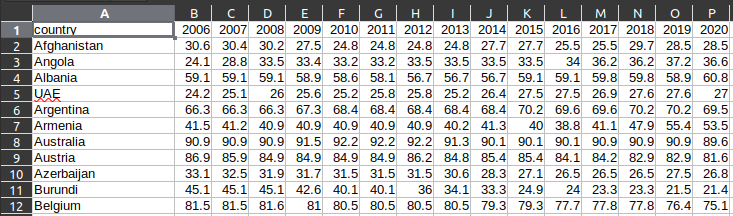
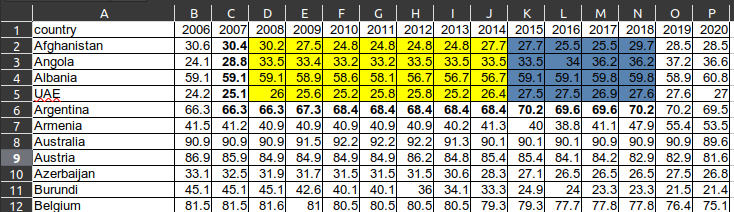
However to be able to produce a table you have to use a spreadsheet program:
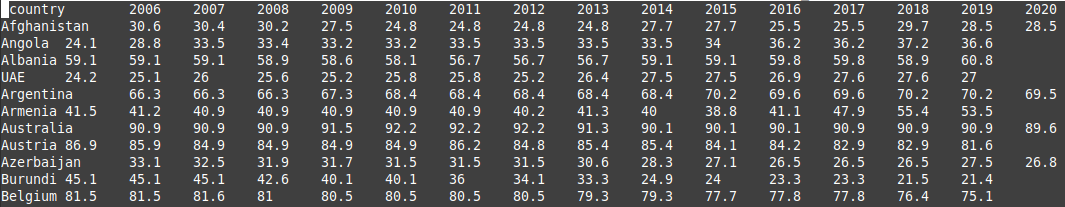
Another popular text file format for storing tabular data is a tab-separated values (.tsv) file. Here cells are not separated by commas but by tabs.
The most popular formats of tabular data are xls and xlsx. Both formats have been popularized by Microsoft. If we open a xlsx file by a software other than a spreadsheet app, it turn out that the file is an archive storing several folders and files.
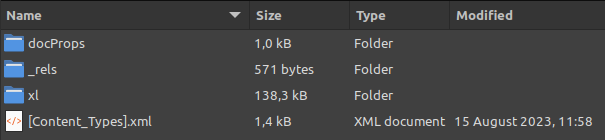
This structure of XLSX-formatted files allows to store additional information like color of cells or fonts characteristics which is not possible in two text-based formats.
The price we however most pay for this kind of additional functions is the increase of file size.
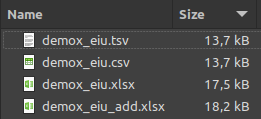
Also almost all text editors and applications are able to open text files where xls and xlsx files are not so universally accessible. Therefore a good practice is to share at least one version of a dataset in a text file format.
There are also other file formats for saving tabular data which are associated with different statistical softwares. RDS-formatted files are used by free and open source R language. SAV files and DTA files are associated with IBM SPSS and STATA proprietary softwares.
A detour – how to upload files to a colab notebook Link to heading
The easiest way is to upload a file from your local computer. You simply select a folder where you want to put a file, you press three dots, and then choose upload function. You can use this procedure to upload files from the Internet into your computer and then upload them into your notebook.
There are several ways to import a file directly from the Internet into your notebook. Here only one used in the class is presented. It shows how to upload a text file (csv, tsv) from a github repository.
The first step is to find a github repository where a file of your interest is stored.
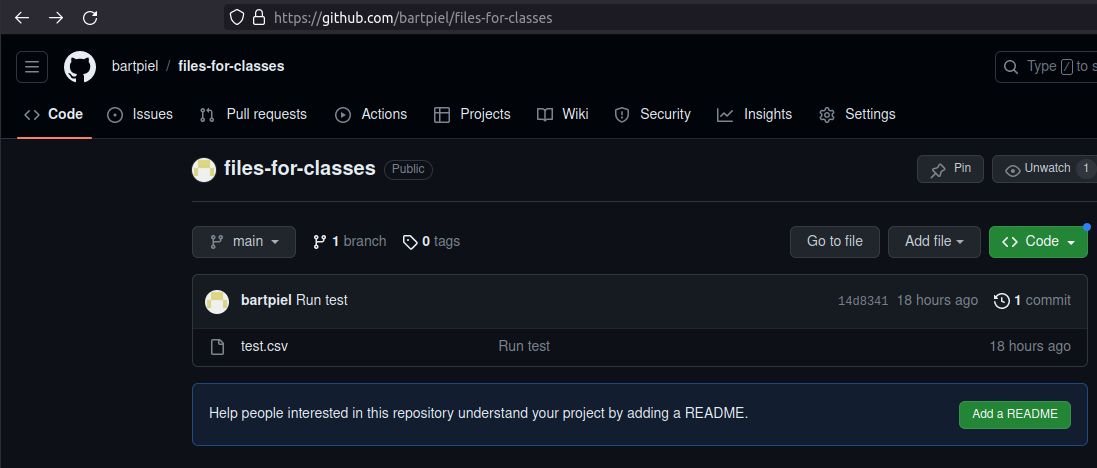
Then you click the file.
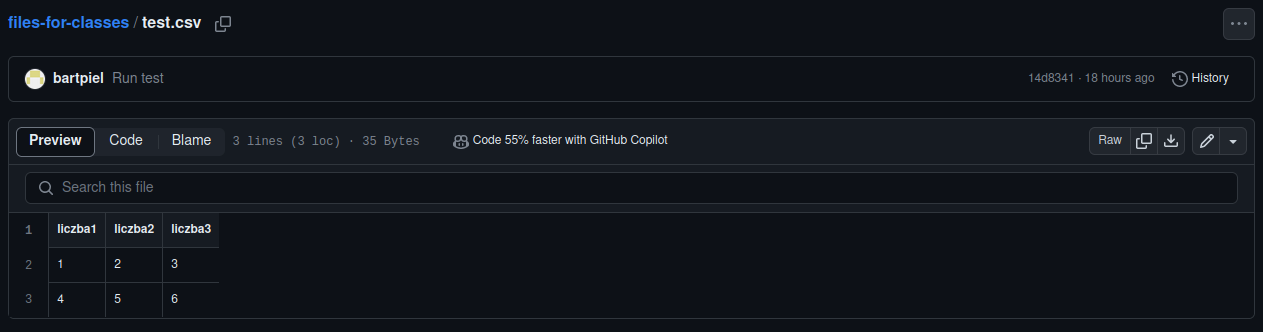
Next you click “Raw” button and see the file in the most rudimentary version.
You copy the address of this page and put into read_csv panda function.
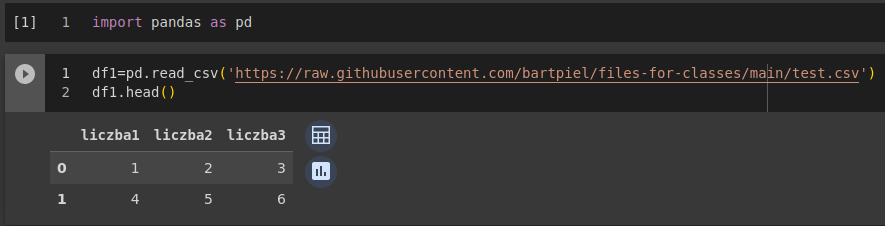
You now have data in your notebook.
Non-tabulator data formats Link to heading
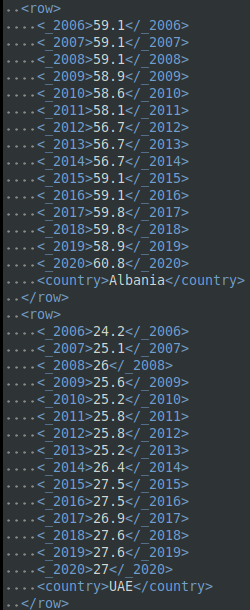
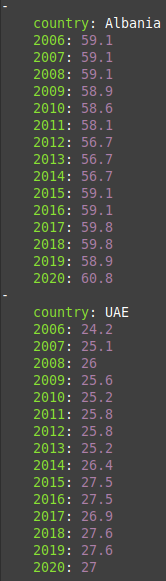
Data can be also written in other than tabular form. Here only one family of such formats will be mentioned: XLM. This format can be seen as file format and as a language – its full name is Extensible Markup Language. What is important from our perspective is that it allows to write a data in particular schema where each observation and variables associated with it forms a separate “paragraph” of a text.
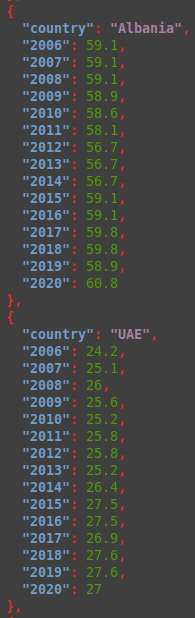
Today two other file formats are gaining on popularity. The first one is JSON: JavaScript Object Notation.
And the second one is YAML.
All three formats are very often used by computer scientists, data scientists and developers. Those formats are most very foten used for storing data on social media. They allow to store long strings of text and metadata link to them in a way comprehensible both for humans and computers.
Format conversions Link to heading
The easiest way to convert file formats is to save a file in different format than it was loaded in. This can be achieved by using one of many spreadsheet softwares. Calc being a part of LibreOffice a free office suite is highly recommended.
This type of conversion is very effective in case of changing formats between tabular data. The problem is with conversion between non-tabular and tabular formats. Here online services can be used. However when our data is sensitive it is not advisable to use this kind of online tools. One should think about local solutions for instance a python libery.
API Link to heading
There are cases when we are not able to find data in the Internet in the form of a file. That does not mean that there is no access to data we are interested in. Very often some datasets are available via application programming interface (API). In the context of the data collection, API could be seen as a way of acquiring data directly from the command line of your computer.
The first step in such a procedure is to get an API key. It is an identification code which is send by your computer to inform a server, where a dataset you are interested in is stored, that it is you who want to download the data set. Usually to receive an API key or token, you have to register your self on the website of a datasets provider and through your account generate and download the token. Please remember to keep the token secret because every one using it will be identify as you.
The second step of using API is to familiarize oneself with a API usage documentation of a particular data provider. There is several way API can be configured and be used in your command line. Some data providers create a library in python or R allowing easy access to data. Others provide their own software for doing this. In the end however, you should be able to search for data and download it from your own computer without using a web browser. Below I provided as an example a use case of using API of a popular data repository Kaggle.
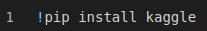
After accruing my API token and saving it in a proper place, I install a python libery create by Kaggle to use its API.
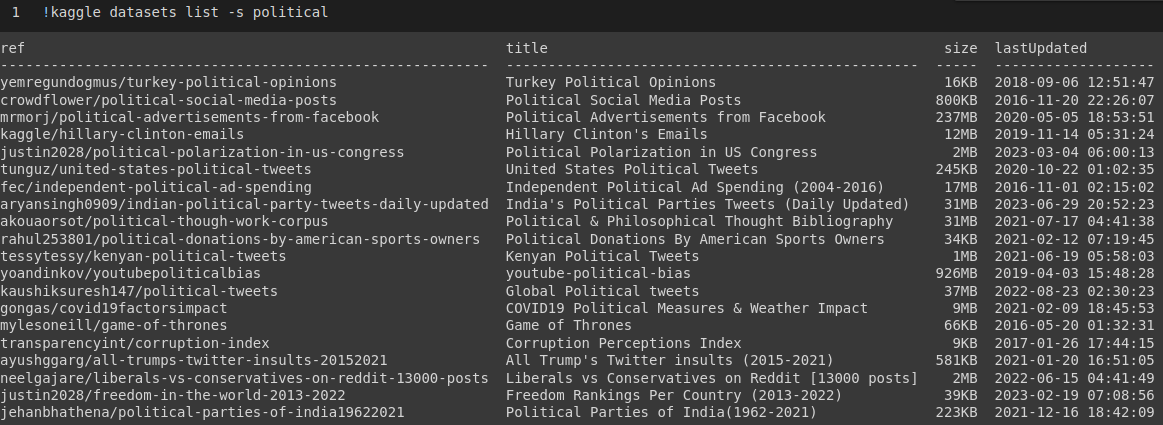
Then I search the Kaggle repository for datasets associated with the keyword ‘political.’
I choose dataset tunguz/united-states-political-tweets and check its content.
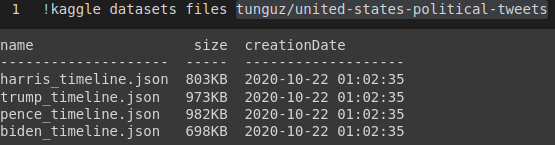
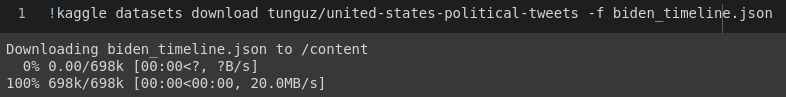
Then I download a specific file.
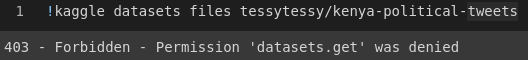
Not always we are successful with accruing data through API. Very often there are some limitation put on a specific data set.
You can follow the whole process in this notebook:
https://colab.research.google.com/drive/1HG8Ow6g7VRApl1Ww4-YVT_oZFXQG7t35?usp=sharing
Scraping Link to heading
It is possible to scrap a table from a webpage. The most popular webpage to scrap tables from Wikipedia. There are several ways to do this. Here only two are presented. The first one is to use a spreadsheet program. I am a fun of free software so I use Calc a part of the LibreOffice office suite. When you open Calc, you go to Sheet than you choose External Links where you provide the program with an url address of a wikipage with a table you are interested in. Then a list of all tables from the webpage is provided. You have to choose the one you are interested in. This way you can easly extarct a table but the output not always look nice. Therefore, you can try another method: you can use read_html function in Python. Take a look into this notebook:
https://colab.research.google.com/drive/1gTh5E65ehbXMrSoGdTlhyrFNg0bnWj5C?usp=sharing